
Q1 2024 San Francisco Multifamily Report

The 2024 outlook for San Francisco Multifamily is filled with promising signs.
San Francisco Multifamily Continues Steady Pace of Transactions
Amidst a challenging economic landscape and global uncertainties, the multifamily market of San Francisco has demonstrated remarkable resilience and a continued positive trajectory. In the first quarter of 2024, signs of recovery and stabilization were observed with a consistent uptick in both velocity and sales prices. Concurrently, the city’s retail corridors have regained vitality, evidenced by increases in multifamily occupancy rates and tourism figures, approaching levels reminiscent of the pre-pandemic era1. Continued recovery has fostered a prevailing sense of optimism within the market, underpinned by encouraging indicators and a forward-looking perspective.
District-by-District Analysis - Trailing Twelve Month Average/Total as of 3/31/2024
Cap Rate | $/SF | Total Transactions - 5+Unit Multifamily Properties - Source: SFAR MLS

The first quarter of 2024 showcased the resilience of the multifamily market in San Francisco. Transaction velocity for 5+ unit sales was on par with pre-pandemic levels, 22 in Q1 2024; vs 23 in Q1 of 2019. Prices too reflected steady improvement, price per SF increased 8.3% from $361/SF to $391/SF in the last 12 months. The rental market is strong as the number of occupied renter households has increased; rents and vacancy have also returned to pre-pandemic levels. While larger 10+ unit sales have experienced a lag in velocity due to tight capital availability, the outlook for the San Francisco multifamily market remains optimistic. Anticipated interest rate cuts and a potential increase in available capital signal promising prospects for continued growth in sales volume and pricing. As capital becomes more accessible, indicative of falling 5-year treasury rates and projected interest rate cuts, LL CRE expects the multifamily market to sustain its positive trajectory, presenting ample opportunities for investors and stakeholders alike.
Cap Rates, $/SF, Sales Volume, and GRM, 5+ Unit Properties

Multifamily Vacancy Rate & Asking Rents

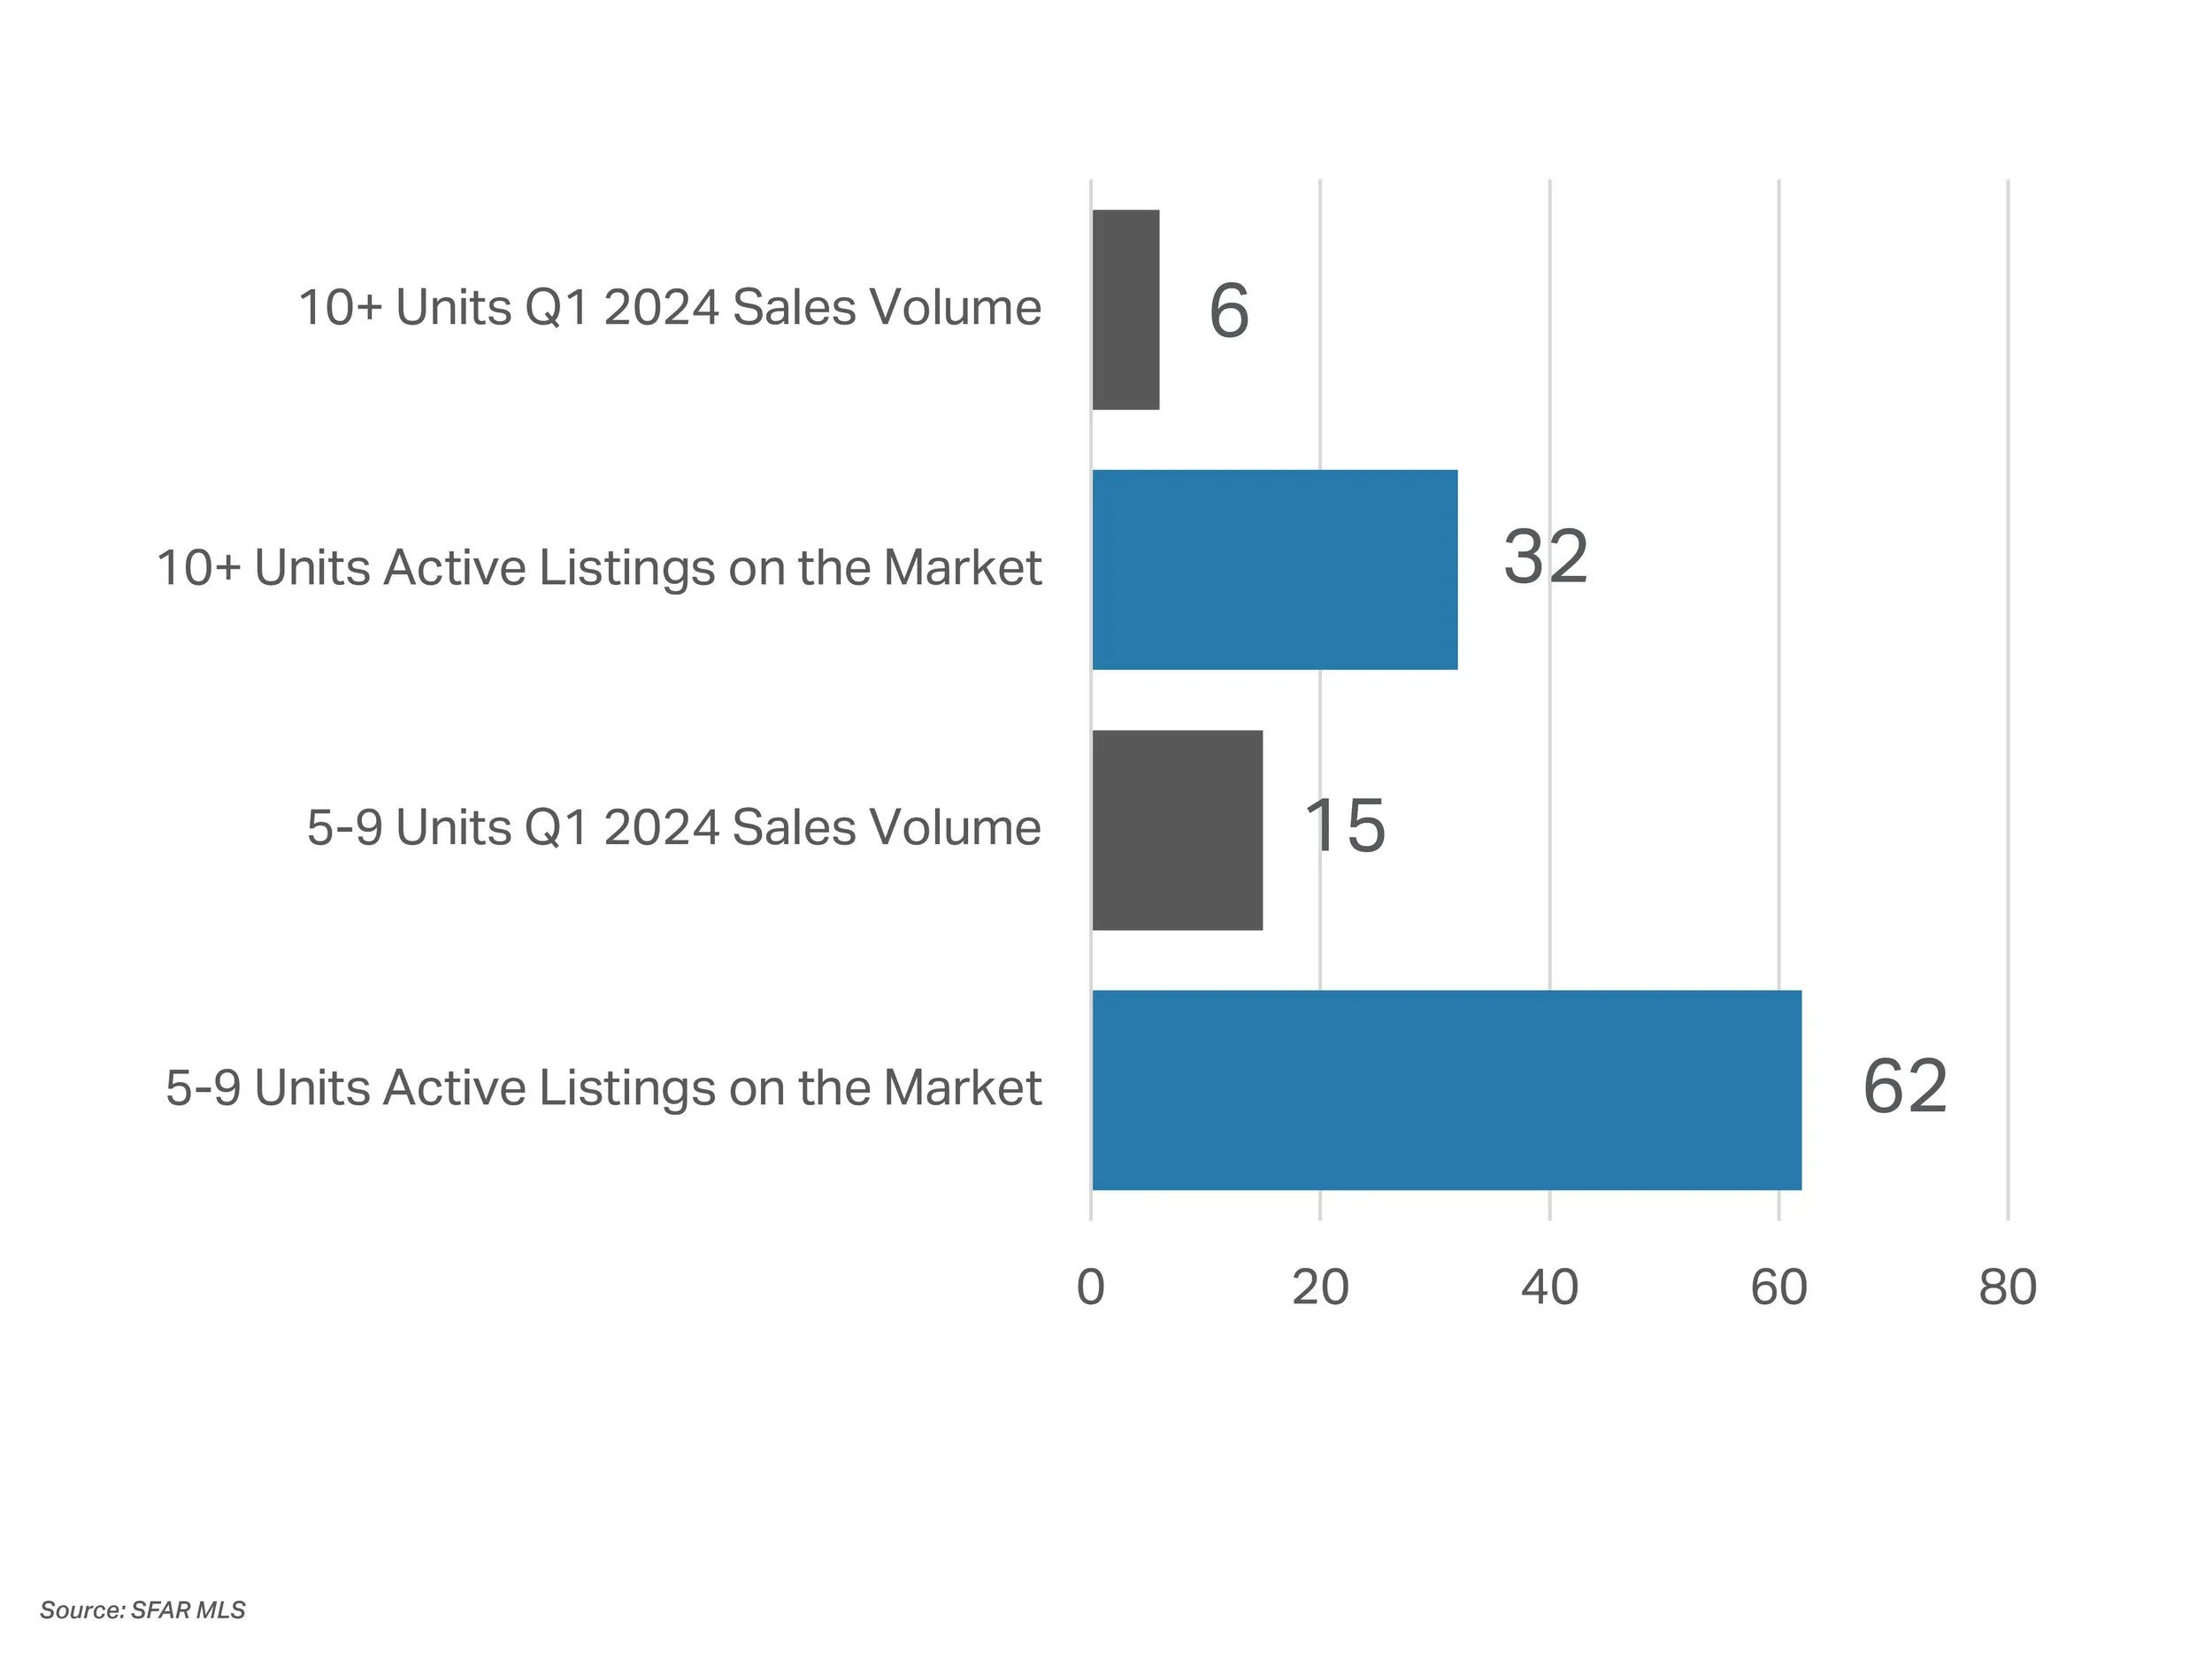
Transaction Volume and Active Listings
Federal Funds Rate, 30-Year Mortgage Rate, 5-Year Treasury, and 25-Year SBA504 Loan Rate

This report has been prepared solely for information purposes. The information herein is based on or derived from information generally available to the public and/or from sources believed to be reliable. No representation or warranty can be given with respect to the accuracy or completeness of the information. Compass and LL CRE Group disclaim any and all liability relating to this report, including without limitation any express or implied representations or warranties for statements contained in, and omissions from the report. Nothing contained herein is intended to be or should be read as any regulatory, legal, tax, accounting or other advice and Compass/ LL CRE Group does not provide such advice. All opinions are subject to change without notice. Compass and LL CRE Group makes no representation regarding the accuracy of any statements regarding any references to the laws, statutes or regulations of any state are those of the author(s). Past performance is no guarantee of future results.
Contact us for more market information or multifamily investment portfolio consultation
Brian Leung
Senior Vice President
Lic. 01203473
415 278 7838
Brian@LL-CRE.com
Jeremy Lee
Senior Vice President
Lic. 01951309
415 988 9719
Jeremy@LL-CRE.com
Carla Pecoraro
Associate
Lic. 02019669
415 312 8901
Carla@LL-CRE.com
Chris Leung
Associate
Lic. 02194279
415 828 9108
Chris@LL-CRE.com